Going into the 2018 season, I’ve been thinking a lot about Trey Mancini. He’s set to be the starting left fielder for the Orioles on opening day, but thanks to the more prominent story lines (rotation holes, Manny rumors, etc), Mancini hasn’t gotten a ton of press. I know I’ve heard a wide variety of opinions on what type of player he’ll be for the Orioles going forward. Some seem sure that he’ll be a star, some would just be happy if he’s an everyday player. So I posed the question on Twitter and here are the results.
Trying to check the pulse on how you all feel about Trey Mancini going forward. What do the #Orioles have in Mancini?
— Luke_Siler (@The_Luke_Siler) March 1, 2018
Most think he’s going to be an above average regular. There is a pretty even split between those who think he’ll be a star player and those who think he’ll be an average player. Somewhat surprising to me, no one answered “role player or worse”. No pessimists to be found apparently.
I’m going to dive into what the Orioles should expect from Mancini during his years of team control, but first, I want to take a quick look at his background and 2017 performance.
Background
The Orioles drafted Trey Mancini in the 8th round of the 2013 draft. He was an excellent hitter in college (.940 or greater OPS all three years at Notre Dame) but fell in the draft due to a few factors. He was a right-handed hitting right-handed throwing first baseman, he didn’t play in any prestigious wood bat leagues, and he was limited to 1B defensively (or so everyone thought).
There were concerns whether he had enough wood bat power to play 1B, and those concerns played out in his first two season in the Orioles’ system. Despite running up gaudy batting averages, he didn’t hit for much power. His ISO (isolated slugging, a measure of game power) was .121 and .125 those first two seasons. That’s fine if you are a shortstop, catcher, or a center fielder, but that doesn’t play at other positions. For comparison, there was one MLB 1B with an ISO lower than .125 in 2017 and it was Joe Mauer, who makes up for it with elite on-base skills.
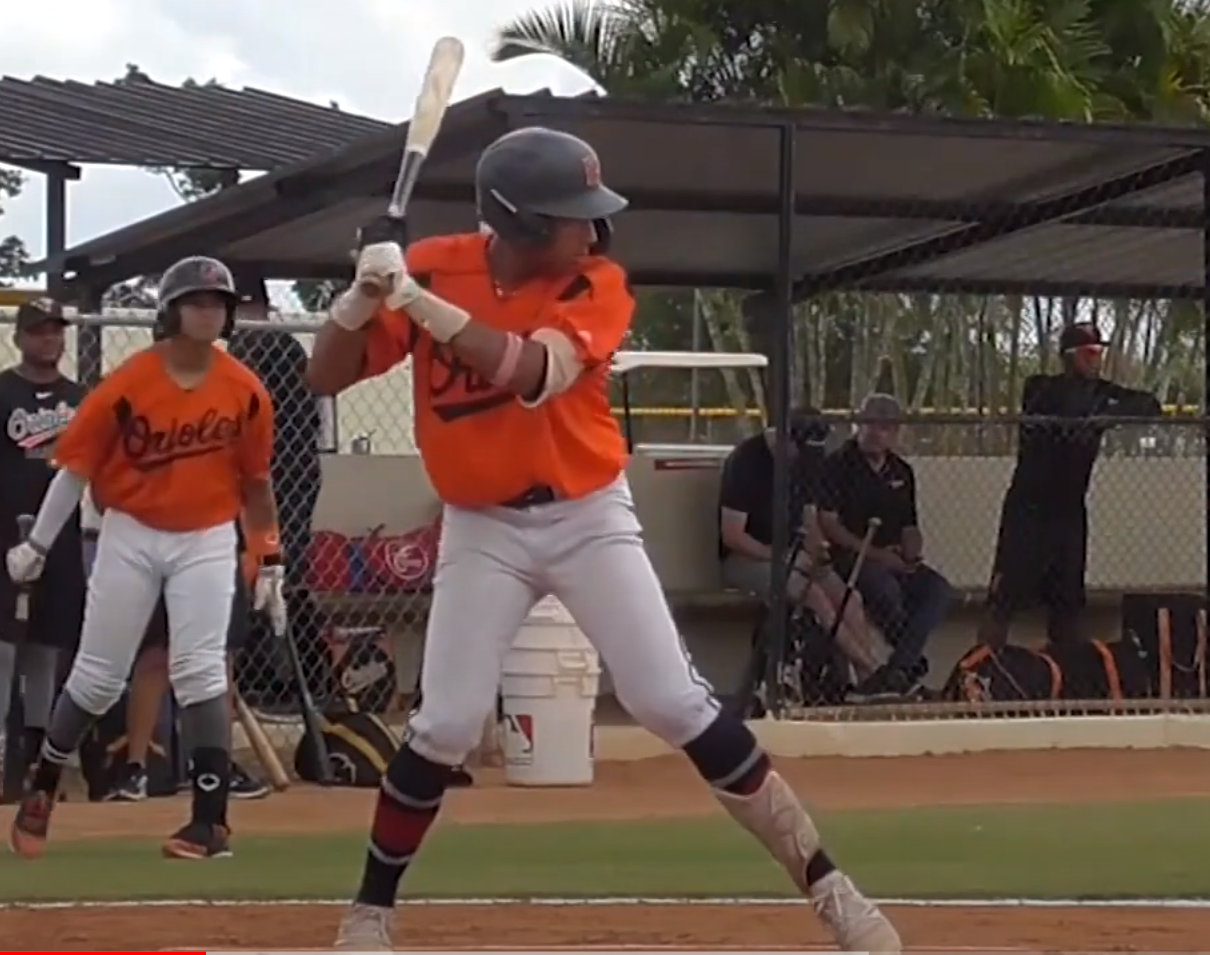
Mancini worked with Brady Anderson on a swing change in Spring Training 2015, which led to a power surge and a breakout season that won him the Brooks Robinson minor league player of the year award. Here is the swing before and after the adjustments.
2013 (video source)

2015 (video source)

So looking at the revamped swing, there are plenty of differences. He holds his back elbow higher, is more upright with a narrower base, loads his hands further back and earlier, opens his hips sooner, and is generally looser. So what does any of that mean for his future value? Well, it shows he’s capable of making wholesale swing changes without getting screwed up. We’ll talk about that a little later.
Alright, let’s flash forward to 2017, Mancini had gotten a cup of coffee in the majors at the end of 2016, but he’d been thoroughly blocked by Chris Davis and Mark Trumbo (the questionable wisdom of those two deals we’ll leave for another article). The Orioles got creative and gave him an outfielder’s glove. He showed enough at the new position to win an opening day roster spot (it didn’t hurt that he raked in spring training) and he quickly earned regular playing time.
2017
In order to make a prediction about Mancini’s future, we need to look at the best data we have, which is his 2017 MLB stats. Before I continue, I’m going to warn you, I’ll be using the various flavors of WAR (Wins Above Replacement). These will serve as estimators of total value. They aren’t perfect, but help put offensive performance in the context of defensive position and ability. I’ll link an explanation of each metric I use at first mention. I’m not going to get into the various different defensive metrics in depth, but I will broadly discuss his defense. wRC+ (Weighted Runs Created Plus) is my go-to offensive metric because it weighs all offensive contributions and adjusts for context (park factors, league-wide offensive environment) which allow you to make accurate comparisons between players in different parks or in different years. wRC+ is also conveniently standardized so 100 is league average, 150 is 50% above league average, and 90 is 10% below league average. It’s important to remember that league average isn’t necessarily league average for a given position. For example, in 2017 catchers had a 89 wRC+ and first basemen had a 113 wRC+. So with those definitions out of the way, here is Trey Mancini’s 2017.
By The Numbers – 2017
wRC+: 117
OPS: .826
fWAR: 1.8
rWAR: 2.2
WARP: 2.0
So he hit 17% better than league average, and worth 2.0 WAR (averaging the three flavors). 2 WAR is basically the definition of an average position player. You might ask, you just said he hit 17% better than league average, how is he just average? Well, he played LF, 1B, and DH primarily. Those positions all have a negative positional adjustment because they are easier to play the the up the middle positions. That makes sense, it’s much easier to find someone who can play 1B than SS. On top of that, Mancini received negative (below average for the position) fielding grades at both LF and 1B. Defensive metrics are far from perfect but each of those WAR calculations uses a different defensive metric and they are all in agreement on Mancini. So those two things counteract the above average bat to end up with average overall value.
2018 and Beyond
Let’s look back to my poll, 79% of respondents said they thought Mancini would be an above average player or a star going forward. In order for that to happen, something will need to improve. He’s probably not going to improve significantly in base-running, not enough to move the needle, so it’ll have hit better or field better or a little of both. Before I get into the ways he could improve, let’s look at what the various projection systems think in regards to his bat. (note: I’m using OPS rather than wRC+ to compare projections because all the projection systems don’t use wRC+)
Projections
Marcel: .840 OPS
Steamer: .782 OPS
ZiPS: .792 OPS
PECOTA: .808 OPS
So of the big 4, only Marcel likes Mancini to improve upon his .826 OPS batting line from 2017. If you look at the projections as a whole, they basically see his walk rate increasing slightly, his strikeout rate decreasing slightly, and his power numbers staying about the same. The projected decline in production is explained by a decrease in BABIP (batting average on balls in play). Mancini had a .352 BABIP in 2017 and that’s likely to decrease. Using a formula that includes the type of batted ball, how hard the ball was hit, and the speed of the hitter, his xBABIP (or expected BABIP) was .329. So perhaps he was a bit fortunate with balls falling for hits in 2017.
Finding Comps
To better understand what to expect from Trey Mancini, I went looking for comparable players. Since his defensive profile is an interesting one, I limited my criteria for comps to hitting performance. There is some evidence that the age of one’s MLB debut is closely related to the likelihood of performance increases. This makes sense because the older a player is when debuting, the closer they are to the peak version of themselves as a player. So I included the age at which a player lost their rookie eligibility as a criterion. Manicini was 25, so I expanded that to include all players in the 24-26 year old range. Next, I wanted to choose players with a similar level of offensive production in their rookie seasons. Mancini had a 117 wRC+, so I limited my search to players between 112-122 wRC+. Finally, I chose a ten year range for these rookie seasons to occur. I chose 2002-2012 because that allowed me to see how those players performed the entirety of their team controlled years.
This search yielded 27 comps, I grabbed comps from every defensive position since this exercise is just looking at offensive production. I looked at the next 5 seasons after each rookie debut and found the players’ wRC+ for that span. I’ll list them below.
| Player | wRC+ | |
| Travis Hafner | 146 | |
| Mike Napoli | 134 | |
| Jayson Werth | 126 | |
| Andre Ethier | 125 | |
| John Jaso | 122 | |
| Curtis Granderson | 114 | |
| Neil Walker | 113 | |
| Todd Frazier | 110 | |
| Brad Wilkerson | 108 | |
| Ryan Garko | 107 | |
| Jon Jay | 106 | |
| Ryan Church | 103 | |
| Denard Span | 100 | |
| Yunel Escobar | 100 | |
| Mitch Moreland | 100 | |
| Dan Johnson | 99 | |
| Chris Johnson | 97 | |
| Geovany Soto | 96 | |
| Danny Valencia | 96 | |
| Jody Gerut | 95 | |
| Eric Hinske | 93 | |
| Nolan Reimold | 93 | |
| Joe Crede | 90 | |
| Alex Presley | 79 | |
| Tyler Colvin | 78 | |
| Alex Cintron | 69 | |
| Jason Phillips | 62 | |
Checking out these comps, we find a few interesting names, some former O’s and a current one (Danny Valencia) as well. Without projecting a defensive improvement from Mancini (which I’ll talk about a bit later), he’d need to improve upon his 117 wRC+ from 2017 in order to become an above average or better starter. Only 18.5% of the comps achieved this type of performance (>117 wRC+) over the length of their team control. Of that group, the player with the most similar debut is Jayson Werth. Werth would be a positive outcome comp for Mancini. After a sophomore slump, Werth had 4 strong seasons with the bat (126, 125, 130, 146 wRC+). Mancini isn’t the defender Werth was in his prime, so he wouldn’t be as valuable as Werth, but that’s still a very good bat.
The next group of comps from 105 to 117 wRC+ represents outcomes that would allow for Mancini to remain an average starter. Although on the lower end of the range, he’d need to play OF more and DH/1B less in order to produce an average WAR total. This group makes up 22% of the comps. Of this group, Curtis Granderson had the most similar debut, although it wasn’t a full season of playing time. Granderson improved his strikeout and walk rates as he gained experienced but his overall line was brought down by a couple of down years. Again, Mancini isn’t nearly the defender Granderson was at the time and wouldn’t be nearly as valuable.
The third group of players are comps that would allow Mancini to be an average player if he plays LF full-time and sees a decent improvement in defensive play. This range is 105 to 95 wRC+ and 33% of the list falls here. Of this group, the most similar player would be Ryan Church. Church put up a few average seasons before becoming more of a role player.
Finally, you have the group that significantly declined from their debut seasons, the <95 wRC+ group. If this is Trey Mancini’s future, he’ll probably be a bench bat or an up and down guy. 26% of my comps had this kind of drop off. A particularly apt Mancini comp, Tyler Colvin is a cautionary tale. Colvin, like Mancini had a great debut, more power even, lower BABIP, but only had one other season where he was even playable afterwards.
So, how well will Trey hit?
Taking in all of the projections and looking at comparable debuts, we shouldn’t expect Trey Mancini to hit better in 2018 and beyond than he did in 2017. The median outcome for the comps is a 100 wRC+, a fairly steep decline from his rookie year 117 wRC+. Projection systems are a little rosier, averaging the four projections above, you get a .806 OPS, not too far off his 2017 line of .826 OPS. It’s important to remember that for the comps, I’m looking at the next 5 years rather than just 2018. All things considered, I think a reasonable expectation would be a small drop off in his sophomore campaign. Still an above average hitter, but with lower BABIP than his seemingly unsustainable .352 from 2017. This would likely place Mancini somewhere between a 1.5 and 2.5 WAR player depending on defense and amount of time at 1B/DH (which have a higher negative positional adjustment).
Make me a star!
So I’m an optimist and I’m sure with the prospect of Manny Machado leaving after this season, fans are hungry for a homegrown star. Trey Mancini seems like a hard working, likable guy and it’d be nice to see him become a stalwart part of the O’s lineup for years to come. So let’s figure out what needs to happen for Mancini to put up consistent all-star level production. I’ll define this as 4+ WAR per season on average. This is a three step program.
Step 1: Play Left Field full-time and improve defensive play there enough to be average there.
So while Mancini doesn’t have the speed or arm strength to really be good in the outfield, he did show a surprising amount of body control and an accurate throwing arm. It’s reasonable to expect some improvement in route running with more experience. It’s also possible the arm strength improves slightly with added reps, as it’s likely arm strength wasn’t a focus as a first baseman. The upside is limited though, Mancini had just a 26.9 ft/s sprint speed which puts him well below average for LF.
Step 2: Improve plate discipline numbers.
This is another reasonable improvement, it’s fairly common for players to increase walk rate and decrease strikeout rate with experience. In 2017, he swung a lot, over 50% of the time. He also didn’t make contact at a very high rate. Looking at his swing and bat speed, you’d expect more contact, there aren’t obvious holes, so perhaps it’s a lack of zone or pitch recognition that may improve with experience. I don’t think it’s reasonable, even as an optimist, to see a big improvement here, maybe just enough to offset a reduced BABIP.
Step 3: Change his swing to add loft.
This is both the most difficult step and the most important. Mancini had just a .195 ISO (isolated slugging, a good measure of game power). For reference, players with similar ISOs in 2017 include such massive sluggers (sarcasm) like Eduardo Escobar, Didi Gregorius, Eugenio Suarez, and Keon Broxton. With a max exit velocity of 115.6mph, good for 19th in baseball in 2017 you’d think he’d be higher than 100th in ISO among players with 400+ PA.
Why was Mancini not producing a stronger power output? Well, he pounded the ball into the ground a lot. You’ve probably heard of groundballs, line drives, flyballs, and pop-ups. Andrew Perpetua runs a site called xStats, which I highly recommend if you are interested in such things. He uses Statcast data to further break down batted ball types. I won’t go into all the particular categories, but there is one of interest to this discussion, “dribble balls”. Dribble balls are balls in play that leave the bat at below 0 degrees launch angle. These are balls that are hit downward and they result in very poor offensive production (.181 batting average, .195 slugging percentage league wide in 2017).
Why are dribble balls important when it comes to Trey Mancini? Well, he was one of the league leaders (14th of 145 with 500+ PA) in dribble ball rate at 39% of all balls in play. That’s not good. Mancini had a robust HR/FB rate of 19.8%, but was well below league average in putting balls in the air. We could stand to reason that Mancini’s power output could be improved substantially if he gets the ball in the air more often while maintaining contact quality.
There was a reason I highlighted Mancini’s swing change earlier in this article, it shows his ability to make significant mechanical changes without screwing himself up. So I’m pleased to announce he has changed his swing again this spring. In addition to reducing his leg kick, he is also keeping his hands lower during the load portion of the swing. This should make it easier to get a slightly upward attack angle when making contact. It’s far too early to know if this change will work for him, but it’s something to watch for in 2018.
Conclusion
It looks like Trey Mancini is likely an average starter going forward. That’s generally below the expectations put on him, but it’s not a bad outcome at all, that’s a solid line-up piece. He does have a shot at being above average or even a all-star type player if everything goes right. There is also a real chance that he never matches his 2017 season, players who debut at his age are at a higher risk of decline than players who debut younger. I’m cautiously optimistic because Mancini appears to be a player who can make necessary adjustments to get the best out of his physical abilities.








Comments are closed.