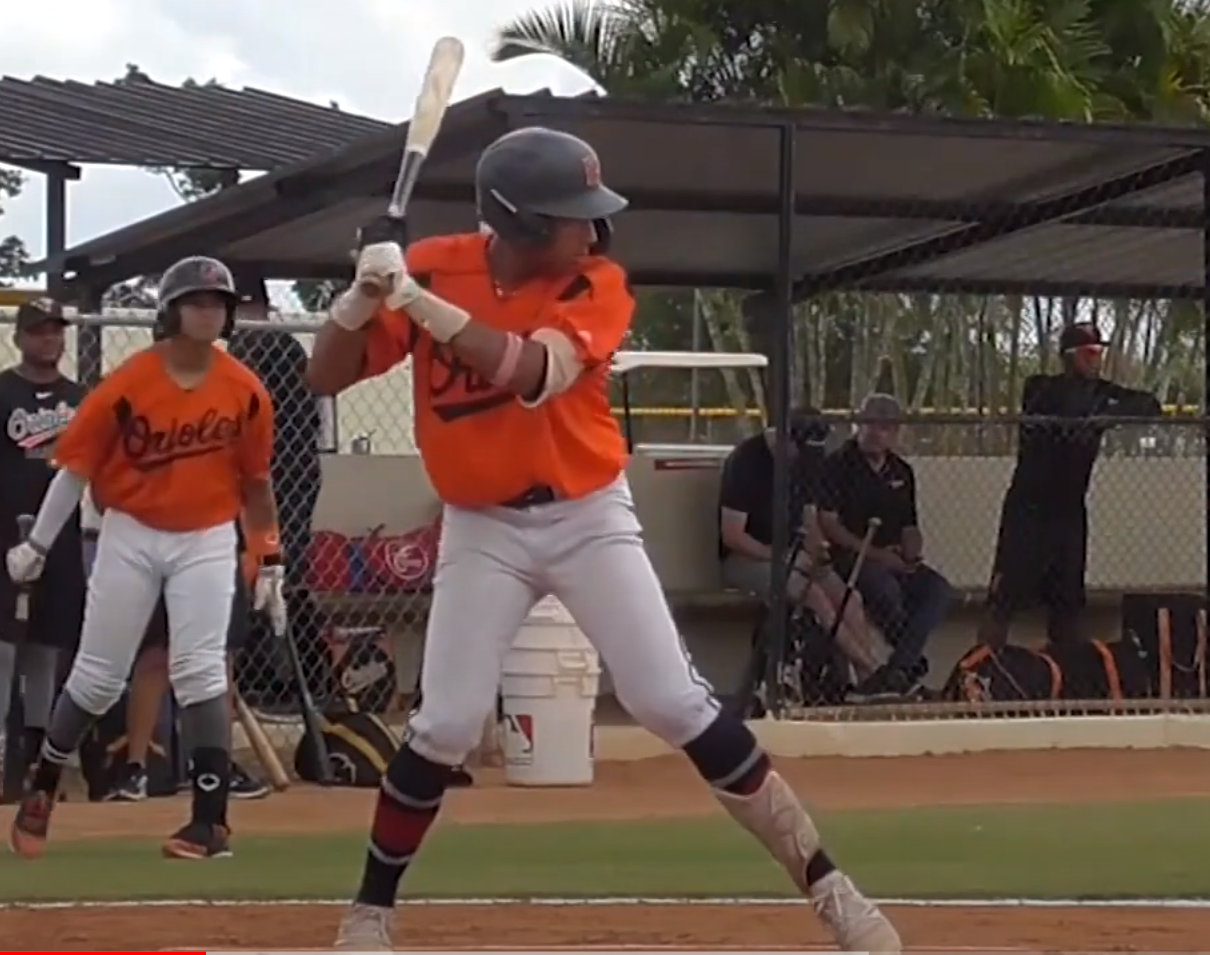
The pull happy lift approach is why Drew Jackson started hitting better. He was doing the old Stanford Swing (definition from Baseball Prospectus if you aren’t familiar with the term, “The Stanford Swing is essentially a swing with very little loft that emphasizes hitting the other way and negates power”) when drafted.
An all-fields approach is overrated. I think it’s counter productive for the most common player types. It does work for players with natural loft and all-fields power (small group) and for players with little to no power, plus contact and speed (bigger group but usually 4th OF or Utility IF types). Jackson has average raw power or a touch better and is far from plus contact, so he doesn’t fit either category. Otherwise, the major of players are better off trying to lift the ball and hit it to the part of the field where their power plays (almost always the pull side).
Here is the Baseball Prospectus article I quoted.
Here’s a simplistic look at a couple cohorts of players out of a population of 214 MLB hitters who had 400+ PA in 2018.
The population as a whole had a 107 wRC+. This makes sense, because part time players (<400 PA are lessor hitters, so it makes sense that players who got a lot of playing time to be better than league average).
The first cohort is players who pulled the ball more than one standard deviation above the mean. The number came out to about 46% or greater pull rate. Those players had on average a 112.5 wRC+.
The next cohort is players who have a true flyball rate (flyballs-IFFB as a percentage of balls in play) of at least one standard deviation above the mean. Those players had on average a 120 wRC+.
The last cohort I looked at (I’ll probably dive deeper later on) was players who pulled the ball at least one standard deviation less than the mean. These players had on average a 100.4 wRC+.
I didn’t do true flyball rate one standard deviation or less than the mean, but anecdotally, looking at the data, that might be the worst cohort of the bunch.
Ran some more numbers, my instinct was wrong.
The worst indicator of performance among the things I looked at (true FB%, Swinging Strike%, and Pull%) was having a low pull rate (basically hitting to all fields). It hurts players more than a high swinging strike rate or a low true FB%.
As far as indicating positive performance, high true FB rate has the strongest benefit, then a high pull rate, and finally a low swinging strike rate.
The fact a low swinging strike rate didn’t correlate with performance as highly as the other two factors was a surprise to me.
Just a note: When I say high or low I mean one standard deviation above or below the mean of MLB players with >400 PA in 2018.


![Drew-Jackson[1]](https://orioleshangout.com/wp-content/uploads/2018/12/Drew-Jackson1.jpeg)


